Benchmarking stealth: score the range, not the number
- #python
- #statistics
- #matplotlib
- #reproducibility
- #pydantic
- #schema-versioning
- #browser-automation
- #stealth
- #building-in-public
stealthbench is my benchmark for browser-automation stealth: it scores stealth setups (configs) against open, self-hosted bot detectors on my own localhost, and commits every result so anyone can rerun it. In update 1 I added a stealth Firefox and printed a table: one number per config, 82, 94, like a fact.
Then I ran the bench again and got different numbers. Not wildly different, but different. That is the whole problem with reporting a single figure for something that doesn’t repeat: you can’t tell a score that means “this config is like this” from a score that means “this config was like this, once.” So this week I stopped trusting one run. I bumped the trials from three to ten, and I drew the spread on the chart.
The bar chart was hiding the wobble
Here’s the new chart. Bar height is the mean tells-panel score over ten trials, colour is the BotD verdict (red caught, green passed), and the whisker is the min-to-max range across those ten runs.
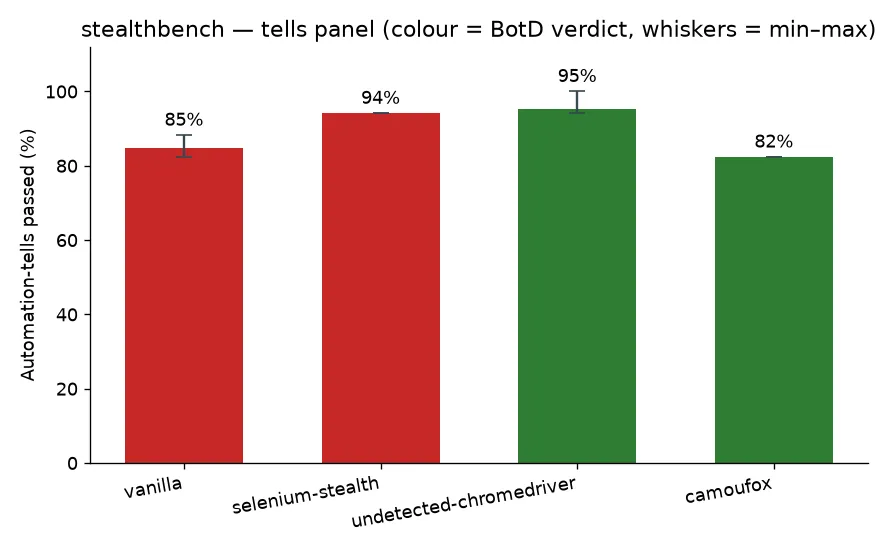
The whiskers are the point. Two of them barely exist and two of them are real, and that split is the thing the old single-number table couldn’t say.
selenium-stealth and camoufox land on 94 and 82 every single time. Ten runs, same answer, no whisker. vanilla (stock Selenium) swings from 82 to 88, and undetected-chromedriver runs from 94 all the way to a clean 100 on its best trials. In the update-1 table those two looked like solid numbers. They aren’t. undetected-chromedriver’s “95%” is really “somewhere between 94 and 100 depending on the run,” and if I’d quoted the trial where it hit 100 I’d have been quietly lying with a real number.
Steady on purpose, or steady by luck
I didn’t expect the split to line up so cleanly, but once it was on the chart it made sense. The two configs that hold still are the two that rewrite the fingerprint deterministically: selenium-stealth applies a fixed set of patches, and camoufox spoofs its fingerprint the same way on every launch, the same fingerprint-spoofing tricks I broke down in an earlier post. Same inputs, same output, so the tells panel sees the same thing each run.
The two that wobble don’t do that. vanilla is stock Selenium with nothing hiding the automation, so what the panel catches shifts with whatever the browser happens to expose that run. undetected-chromedriver patches things at runtime, and runtime is exactly where timing and load leak in. The wobble isn’t noise I need to average away. It’s the honest shape of a config that behaves a little differently every time you start it, and that is worth knowing before you trust it in production.
What “± 3” means here, and what it doesn’t
The table under the chart now carries the same spread in text, mean ± stdev [min–max]:
| Config | Tells % | BotD | CreepJS lies |
|---|---|---|---|
| vanilla | 85 ± 3 [82–88] | caught (selenium) | 0 |
| selenium-stealth | 94 ± 0 [94–94] | caught (selenium) | 2 |
| undetected-chromedriver | 95 ± 2 [94–100] | passed | 0 |
| camoufox | 82 ± 0 [82–82] | passed | 0 |
One thing I was careful about: that ± 3 is descriptive, not a confidence interval. It’s the actual min, max, mean, and standard deviation of the ten numbers I saw, nothing more. Ten runs from one machine on one afternoon is not a sample I can make a real inferential claim from, and putting a “95% CI” on it would overstate what those ten runs support. So the report says spread and stops.
The implementation uses statistics.pstdev (population) instead of stdev (sample). Sample stdev divides by n - 1, which blows up on a single value; population stdev divides by n and gives a clean 0.0. That matters because a --trials 1 run should print ± 0, not crash, and test_spread_single_trial_has_zero_stdev pins exactly that.
Keeping the old numbers readable
Adding spread and version metadata meant changing the shape of the results file, and update 1’s whole pitch was that every number traces to a committed results/*.json. That promise breaks the day new code can’t open an old file. So the rule for the v2 schema was: every new field is optional or defaulted.
class RunMetadata(BaseModel):
    schema_version: int = SCHEMA_VERSION  # now 2
    single_ip_caveat: bool = True
    components: dict[str, str] = {}        # driver versions; absent in v1, so it defaults
A v1 snapshot has no components key, so it parses because the field defaults to empty. I pinned the oldest snapshot in the repo as a regression fixture, results/20260706T155231.json, from back when the bench was three Chrome configs and no Camoufox, and a test refuses to let any future change stop it from loading. The components map, while I was there, records the versions that actually ran (chrome 149, playwright 1.59.0, camoufox 0.4.11, and so on), read from the environment with importlib.metadata.version(...). Numbers only: driver versions and a browser major, no IP and no fingerprint. And because that reads package metadata by name rather than importing the SDK, it doesn’t touch the provider seam from update 1.
The last thing I added walks every committed snapshot and plots tells-percentage over time, so update 1’s “today’s pass can be caught next week” is something I can watch now instead of just assert. It’s young: three snapshots over two days is a couple of points, not a trend line yet. When a config is missing from an older run I draw a gap, never a fabricated zero. The layer is in; it fills itself one committed run at a time.
What’s next
The measurement side is in decent shape now: the scores show how much they move, the schema still reads its old snapshots, and the trend line fills in as I commit runs. The thin part is the detector side. I want more signals to score against, and a headful CI run so the snapshots regenerate on a schedule instead of when I remember to.
The question this update left me with, for anyone who benchmarks something non-deterministic: how many runs do you do before you believe a spread? I did ten because it was enough to separate the steady configs from the wobbly ones on this panel, but I don’t have a principled number, just a chart that stopped surprising me. The repo is at github.com/bessavagner/stealthbench if you want to see the runs behind the bars.
I'm building this in the open, one update at a time.
Keep reading
- Reproducible in principle, not in practice: one command to run the benchUpdate 4 of the stealthbench build log. stealthbench scores browser-automation stealth setups against self-hosted bot detectors on your own localhost and commits every result. For three updates I'd pitched it as 'anyone can rerun this,' but the actual bring-up was a five-step shell ritual I'd memorized: npm ci and serve the panels on :8901, git clone CreepJS and serve its docs on :8902, then run. This update collapses the four-line server half of that to one command, `python -m stealthbench.serve`, a stdlib-only module (http.server, subprocess, urllib, no new deps) that runs npm ci, fetches CreepJS once, serves both roots, and health-checks each URL until it returns 200 before it says ready. That surfaced a real design question: the whole project rests on 'detectors self-hosted on localhost only,' yet serve does a `git clone` from GitHub. I drew the line at setup versus run time: the fetch is a one-time, idempotent setup step (skipped if the dir exists), and the bench itself still contacts only localhost. The other landed story is `--config`/`--detector` flags to run a subset, built so a bare run is byte-for-byte the old matrix (the no-selection path returns the same list object, identity, so the numbers can't move), a de-selected cell is absent and never a fabricated 0, and an unknown name errors at parse time. The third story, PyPI packaging, I cut.July 22, 2026
- A release with no secrets: OIDC trusted publishing, and the tag I didn't pushUpdate 5 of the stealthbench build log. stealthbench scores browser-automation stealth setups against open, self-hosted bot detectors on your own localhost and commits every result. The last story on the roadmap was packaging, and its spec left one thing deliberately unpinned: publish to real PyPI now, or wire the release pipeline against TestPyPI and stop. This update is that decision and what it cost. I aimed the pipeline at TestPyPI, and the reason is visible inside the wheel itself: `python -m zipfile -l` shows the four vendored detector panels ship, but `node_modules/` doesn't, and `botd.html` imports its detector bundle from exactly there. So the wheel carries a detector page and not the bundle that page loads, on top of needing Chrome, Camoufox's patched Firefox, and Node that no Python package can provide. The release itself uses PyPI's OpenID Connect trusted publishing: `id-token: write` lets the job mint a short-lived identity per run and the index verifies which repo, workflow, and environment it came from, so no long-lived API token is stored anywhere. Two console scripts (`stealthbench`, `stealthbench-serve`) give the module invocations from the last two updates real names, and the version went 0.0.1 to 0.1.0. The honest ending: `git tag` returns nothing, so the trigger has never fired, which was a choice. But checking rather than asserting turned up something I hadn't chosen: `gh api .../environments` returns an empty list, so the `testpypi` environment the workflow names doesn't exist, and the pipeline I'd been calling wired is one step short of it. The only build in existence is the one `uv build` made on my laptop in a git-ignored `dist/`.July 31, 2026
- Every falsy value went missing: adding nodriver to the stealth benchUpdate 3 of the stealthbench build log. stealthbench scores browser-automation stealth setups against self-hosted bot detectors on your own localhost and commits every result. This update widens the matrix: two more detectors (a Sannysoft-style panel and rebrowser-bot-detector) and a fifth config, nodriver. nodriver is async and the bench's BrowserHandle contract is sync, so the new handle drives each call to completion on a private event loop. Wiring it in surfaced a real bug: nodriver's tab.evaluate(return_by_value=True) drops falsy results (its unwrap tests `if remote_object.value:`, so 0/false/'' vanish) and leaves plain objects wrapped in a RemoteObject, so detector signals came back as None or garbage. The fix is to stop fighting its unwrap: wrap the script in JSON.stringify and json.loads the returned string, which round-trips every value faithfully. With that fixed, the two new panels mostly corroborate the tells ranking (undetected-chromedriver and nodriver ace both, vanilla and selenium-stealth get dinged), and camoufox runs only 9 of rebrowser's 10 tests because one is Chrome-specific.July 18, 2026
Get the next update by email
Build-in-public updates and new posts, delivered as a digest. Double opt-in · no spam · unsubscribe anytime · handled by Buttondown.