The job that fired and never ran: why both of my alerts were structurally blind to it
- #gcp
- #cloud-run
- #monitoring
- #alerting
- #postgres
- #iam
- #building-in-public
- #govtech
Brazil’s federal government publishes what it does in the Diário Oficial da União, the official gazette. RegWatch reads it every morning, matches the day’s acts against terms each client is watching, and mails a digest. Reading a gazette means storing it, and storing a few thousand acts a day adds up, so there is a weekly job that deletes the text of old acts nobody matched. It runs on Cloud Run, triggered by Cloud Scheduler at 04:00 on Sundays.
It had a schedule. The scheduler fired it. It had never run.
Not failed. Never started: zero executions, ever, and no line anywhere saying so. I found it six days later by going to look at something else, and the interesting part is not the missing permission. It is that neither of the two alert policies I already had could have told me, and neither could a third one built the same way.
What I was actually looking at
I was writing a follow-up review after tuning a noisy watch and pulled the usual state. The scheduler job looked wrong immediately:
$ gcloud scheduler jobs describe regwatch-prune
lastAttemptTime: '2026-08-23T07:00:00.812819Z'
status:
  code: 7            # PERMISSION_DENIED

$ gcloud run jobs get-iam-policy regwatch-prune
(empty)
An empty IAM policy on that job, while regwatch-run-daily and regwatch-heartbeat both carried roles/run.invoker for the same scheduler service account. The trigger was real, the job was real, and the scheduler was not allowed to press the button.
The root cause is one line of the provisioning script, and it is the boring kind:
for job in regwatch-run-daily regwatch-heartbeat; do
  gcloud run jobs add-iam-policy-binding "${job}" --region="${REGION}" \
    --member="serviceAccount:${SCHED_SA}" --role="roles/run.invoker"
done
A hardcoded list of two, written when there were two jobs, never extended when the third arrived. The CI deploy updates each job’s image and its arguments on every release, so the prune job was being kept current in every respect except the one that let it start. Nothing in that pipeline touches IAM, so nothing closed the gap after the fact.
The trigger shipped on 2026-08-20 and I found this on 08-26, so it had exactly one Sunday to be denied on, and it used it.
Both alerts were watching the wrong noun
I had two alert policies at this point, both added after the week RegWatch failed at 8am. Both trigger on the same metric:
completed_execution_count{result="failed"}Read that as a sentence and the problem is in it. It counts executions that completed with a failure. A denied trigger creates no execution at all. There is nothing to complete, nothing to count, and the metric stays at zero, which is exactly what it looks like when everything is fine.
The instinct on finding a gap like this is to copy the policy for the job that fell through. That would not have worked either. A prune-specific copy of a policy that watches failed executions is still watching failed executions, and this job has never produced one. The gap is not a missing policy. It is a missing noun. Nothing in the system was watching triggers, only runs.
That is a different failure from the one in update #8. There the alert fired, on real evidence, at a time of day that made it useless. Here the alert cannot fire, because the event it would have to see is emitted by a different service into a different place. The heartbeat has the same hole from the other side: it reads the latest run of a given date and stays quiet if that run looks fine, so a job with no runs at all never enters its field of view.
The alert I actually wanted, and how I knew it worked
The denial does leave a trace. Cloud Scheduler logs an AttemptFinished record for every attempt, successful or not, and a denied one comes through at severity ERROR. So the policy is a log-based one on that:
resource.type="cloud_scheduler_job" AND severity>=ERROR
  AND jsonPayload."@type"="type.googleapis.com/google.cloud.scheduler.logging.AttemptFinished"
An alert is a claim about the future, which makes it exactly the kind of thing I ship and never find out about. So I backtested it. Running that filter over the previous 30 days of logs returns exactly one event: the 08-23 denial. One true positive, zero false positives, across a month that included a real upstream outage and a retried morning run.
That number does two jobs. It says the policy would have paged me on the Sunday instead of on the following Wednesday, and it says the policy will not page me for anything else, which is the property that decides whether an alert survives contact with a human. I also wrote the reason into the policy itself, where the next person to look at it will be:
A Cloud Scheduler trigger could not launch its Cloud Run job, so NO execution exists. The two execution-count policies cannot see this: they alert on jobs that ran and failed.
A policy that explains what it is for is a policy nobody deletes during a cleanup because they could not remember why it was there.
Meanwhile, a real deadline
None of this would have been urgent if the missing job were cosmetic. It was holding back a clock.
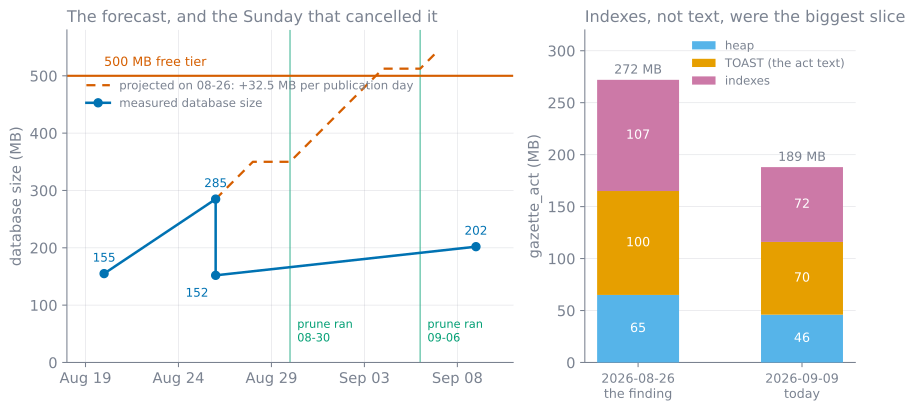
The database had gone from 155 MB on 08-20, straight after a manual prune, to 285 MB on 08-26. That is about 32.5 MB per publication day, a little over twice the 15 MB/day the runbook estimates, and the reason for the gap turned out to be the interesting part: the runbook’s estimate counted the act text and not the indexes built over it.
RegWatch’s Postgres runs on a 500 MB free tier. Headroom was 215 MB, which at that rate is 6.6 publication days. The forecast put the breach around 2026-09-04.
The cheapest 85 seconds in the project
I granted the binding and ran the prune by hand. It deleted 14,255 acts nobody had ever matched, stripped the text from 310 more that clients had matched, then vacuumed and reindexed: 285 MB to 152 MB, in 85 seconds.
The part I did not expect is in the right-hand panel. Of the 272 MB the acts table occupied, the indexes were 107 MB, more than the act text they were built over, and the single trigram index was 67 MB on its own. Autovacuum had been doing its job the whole time and the heap was clean, n_dead_tup = 0. It still could not give the space back, because autovacuum does not shrink an index. The REINDEX is the step that returns the disk, and index bloat is invisible to the process most people assume is handling it.
Which raises the question of where the bloat came from, and that one is mine. The midday safety-net run re-parses a day the morning run already stored, and ingest_edition pushed every act through update_or_create, which issues an UPDATE whether or not anything changed, followed by a blanket search-vector rebuild across the whole edition. Two writes per act per run, two runs a day, on rows that were byte-identical: around 7,000 dead row-versions a day, and the indexes grew over all of them.
The fix diffs each act’s content fields and writes only what changed. The test that keeps it honest asserts on Postgres row versions directly, because the naive assertion, that the content is still correct, passes just as well when every row has been needlessly rewritten:
def _xmin(act_pk):
    """The row version. Postgres bumps it on every UPDATE, even a no-op one."""
    with connection.cursor() as cur:
        cur.execute("SELECT xmin FROM gazette_act WHERE id = %s", [act_pk])
        return cur.fetchone()[0]


@pytest.mark.django_db
def test_reingesting_identical_content_writes_nothing():
    ingest_edition_result(_raw_two())
    before = {a.pk: _xmin(a.pk) for a in Act.objects.all()}

    result = ingest_edition_result(_raw_two())

    assert result.acts_written == 0
    assert {a.pk: _xmin(a.pk) for a in Act.objects.all()} == before, (
        "unchanged acts must not be rewritten"
    )
That went out as 7a513e8, with the provisioning and alerting fix as 3cf5a0f.
What actually happened on September 4th
The forecast is the part of this I most wanted to check before publishing, because a projection is a promise about a date, and that date has now passed.
It did not happen. The Sunday 08-30 trigger fired for the first time in the job’s life and the execution succeeded: 11,480 acts deleted, 38 MB of text freed, vacuum and reindex, exit(0) about 75 seconds after it started. The following Sunday, 09-06, it ran again on its own: 21,140 acts, 79 MB. Four executions now exist for that job, all of them succeeded, and two of them nobody launched.
I measured the database again while writing this, on 2026-09-09. It is 202 MB. September 4th came and went with 300 MB of headroom, because the fix landed five days before the first Sunday that mattered.
The forecast was not wrong. It was a correct description of a system nobody was going to intervene in, and its whole purpose was to make somebody intervene.
What I learned
Alerts are written against the events your infrastructure emits, not against the failures you can imagine. I could describe this failure perfectly well in advance, in a sentence, and it still would not have been caught, because “the job did not run” is not a thing Cloud Run publishes. It is an absence, and absences do not have metrics. The general form: for anything that must happen on a schedule, alert on the heartbeat of the trigger, not only on the outcome of the work, because those are two different systems and only one of them is yours.
A provisioning script with a hardcoded list is a fourth place to remember to update. The prune job was added to the deploy workflow, the runbook and the scheduler, and missed in exactly one loop that nobody reads unless they are provisioning from scratch, which by definition is the one situation where its being wrong is invisible. The version I would trust reads the job names from the same place everything else does.
Backtest an alert before you trust it. Running the filter over 30 days of history took a minute and turned “this should catch it” into “this catches exactly one thing, and it is the thing”. Every alert I have ever deleted was deleted for firing too often, and I had never once checked that number before enabling one.
What’s next
The open item from both of the last two reviews is still open, and it is the one that decides whether any of this matters: 947 of 950 matches had never been triaged, so there is no measurement of whether the feed is any good. On 08-30 I shipped a way to judge a match from the keyboard, in the console I rebuilt around a live demo, which removes the excuse. Whether it produces actual labels, or joins the list of tools I built and did not use, is the next thing worth writing down, and I already know how that story goes when I build the tool and skip the boring half.
I have written before about getting a scheduled job right when it runs twice, which turns out to be a much easier problem than getting told when it runs zero times. So the question I would put to anyone running scheduled work in the cloud: what alerts you when a job does not start? Not when it fails, when it never begins. Every answer I have found so far is a dead-man’s switch of some kind, a thing that complains about silence, and they all seem to need a second system to hold them. The series is where I keep publishing the parts I get wrong.
I'm building this in the open, one update at a time.
Keep reading
- One stack trace, two root causes: the week RegWatch failed at 8amUpdate 8 of the RegWatch build log: the same login error had two completely different causes a day apart, and I could only tell them apart because I had shipped logging that fixed nothing. Notes on observability as the actual fix, on an alarm scheduled in the wrong gap, and on the retry window I widened that still wasn't wide enough.September 10, 2026
- Unattended at last: RegWatch on Cloud Run, and the round-trip that nearly killed the jobUpdate 4 of the RegWatch build log: taking the daily pipeline off my laptop and onto GCP Cloud Run Jobs against Supabase. The plan was clean; the first live deploy was not. Three quick config failures, and then the one that taught me something: a cross-region round-trip that timed the job out at a full hour, until co-locating Cloud Run with the Supabase region dropped a whole gazette day to ten minutes.July 9, 2026
- Wrong twice about one word: legal polysemy and the excludes I found by reading 31 actsUpdate 10 of the RegWatch build log: one Portuguese word drove about 12% of a client's feed, and my first fix would have thrown away every real match along with the noise. Notes on a legal homonym that defeats full-text search, a tool that finds exclude phrases from the text around a term, and the second retraction that ran the other way.September 24, 2026
Get the next update by email
Build-in-public updates and new posts, delivered as a digest. Double opt-in · no spam · unsubscribe anytime · handled by Buttondown.