One stack trace, two root causes: the week RegWatch failed at 8am
- #observability
- #debugging
- #incident
- #cloud-run
- #gcp
- #retries
- #building-in-public
- #govtech
Brazil’s federal government publishes what it does in the Diário Oficial da União, the official gazette. Every contract, appointment, grant and sanction lands there, tens of thousands of acts a month. RegWatch reads it every morning so that a law firm doesn’t have to, matches the day’s acts against what each client is watching for, and mails out a digest.
For a week in July it read nothing at all. Every scheduled run died in the same place, on the same line, and I fixed it twice. The second fix was for a completely different problem than the first, and I only knew that because I had shipped a change that repaired nothing whatsoever.
The numbers below come from Cloud Run logs I pulled on 21 July, while the incident was live and before the retention window ate them. The verdict at the end needed five more weeks of production to arrive.
A week of one red line
regwatch-run-daily is the scheduled job that does the morning ingest. Between 14 and 20 July it failed on nearly every run, always here:
RuntimeError: INlabs login failed: session cookie not setINlabs is the government’s bulk distribution service for the gazette, and logging into it is the first thing the ingestor does. No session cookie, no editions, no pipeline. The error is raised by my own code, which had checked for exactly this and said so clearly.
It was still the wrong story. The cookie was missing, but nothing about why was in that message.
The newline you cannot see
The credentials were correct. I could paste them into the INlabs login form in a browser and get in. The bug was not in the code either.
gcloud secrets versions list INLABS_PASSWORD showed two versions created 68 seconds apart, at 21:16:30 and 21:17:38 on 15 July: a bad paste, then a re-paste. The re-paste is the one that mattered, because of how it got there.
echo 'the-password' | gcloud secrets versions add INLABS_PASSWORD --data-file=-echo appends a newline. Secret Manager stores the bytes it is given, and Cloud Run injects them into the environment variable verbatim. So the password RegWatch sent had a trailing \n that no human inspecting it anywhere would ever see. The fix is one character of shell:
printf '%s' 'the-password' | gcloud secrets versions add INLABS_PASSWORD --data-file=-This was the second time that month the same bug class bit me. It had already broken a Docker build through GCP_PROJECT_ID, which is how the deploy learned about it the first time. A value that is correct in every place a person can look at it, and wrong in the only place that reads it, is a failure that lives in the handoff between two systems rather than inside either one.
“RESOLVED” was the trap
I wrote up the postmortem, marked it resolved, recorded the cause as a corrupted secret, and moved on.
That note nearly cost me the next day. It taught me to expect this stack trace to mean “the password is wrong”, which is a conclusion, and conclusions are exactly the thing a postmortem should be most careful about handing to its future reader. What it should record is the signature: what you saw, and what the same thing could also mean.
Shipping a diagnostic instead of a fix
Here is what actually bothered me once the secret was fixed. Two completely unrelated conditions produced a byte-identical failure. A wrong password gives you a login page back instead of a session. So does an upstream that is down. My code saw “no cookie” in both cases and raised the same RuntimeError.
So the next release, v0.11.1, shipped the smallest thing that could tell them apart:
logger.error(
    "INlabs login failed: status=%s body_preview=%r",
    response.status_code,
    response.text[:300],
)
A status code and 300 characters of body. Never the credentials, which is the whole reason the preview is bounded and the request body is nowhere near it.
That change fixed no bug. It closed no ticket. Shipped on 20 July as commit 0e53e1d, it made the system’s failures legible and left its behaviour exactly as broken or as working as it had been the day before.
The next morning, same traceback, different cause
21 July, the 08:05 run failed. Identical Python traceback. By my own resolved postmortem, that meant the secret was corrupted again.
One log query, and it wasn’t ambiguous any more:
INlabs login failed: status=502 body_preview='<!DOCTYPE html>\n<html lang="pt-BR">
  <title>Sistema em Manutenção</title>...'
POST https://inlabs.in.gov.br/logar.php "HTTP/1.1 502 Bad Gateway"  x3
Sistema em Manutenção: system under maintenance. The gazette’s distribution service was in a maintenance window. Nothing to do with my secret, my code, or my deploy, and nothing I could do about it. A diagnosis that would have cost me a day of chasing the wrong lead cost one query instead, on a change that had shipped 14 hours earlier and fixed nothing.
That is the argument for observability that I find people nod along to and then not fund. The payoff isn’t a bug repaired. It’s the day you don’t lose.
Two defects the logs handed me for free
Once the log line existed, it kept talking.
The retry window was three seconds. The timestamps gave the whole budget away:
11:06:41.28  502
11:06:42.43  502     (1s backoff)
11:06:44.57  502     (2s backoff, then give up)
Three attempts at backoff * attempt. That is sensibly tuned for a dropped TCP connection and useless against a maintenance window measured in minutes. I changed it to exponential backoff with a cap, 2, 4, 8, 16, 32, 60, so the last of seven attempts fires about two minutes after the first:
DEFAULT_MAX_ATTEMPTS = 7
DEFAULT_BACKOFF_SECONDS = 2.0
DEFAULT_MAX_BACKOFF_SECONDS = 60.0
Only transient statuses get this treatment. A clean response that simply carries no cookie still fails on the first try, so a genuinely bad password is never retried for two minutes.
The alarm was scheduled in the wrong gap. RegWatch runs three cron jobs, all America/São_Paulo:
| job | schedule | role |
|---|---|---|
regwatch-morning |
5 8 * * 1-5 |
first attempt at the day’s run |
regwatch-heartbeat |
0 9 * * 1-5 |
the alarm |
regwatch-midday |
0 13 * * 1-5 |
the safety net that actually recovers the day |
Read the middle row against the other two. The alarm sat between the first attempt and the sweep that fixes it, so it paged on every morning blip, including the days that went on to recover completely on their own at 13:00. That happened on 17 July. I got the page, and the system was fine four hours later without me.
An alert that fires before your recovery mechanism has run is a scheduled fire drill. I moved the heartbeat to 0 14 * * 1-5, after the midday sweep, in commit 35850c2. Alarm placement is a design decision and I had made it by accident, which is roughly how I make most of my worst scheduling decisions.
The same afternoon, production graded the work
The 13:00 sweep on 21 July hit the very same 502s and finished anyway. Both attempts are in one Cloud Run execution, because the job is configured with maxRetries=1:
| attempt | time (UTC) | result |
|---|---|---|
| 0 | 16:00:40 to 16:00:44 | three 502s in 3.3s, exit(1) |
| 1 | 16:02:14 to 16:09:21 | login 302 Found, exit(0) |
run_daily 2026-07-21: editions=3 acts=3338 matches=0 enriched=0 digests=0Three editions ingested, 3,338 acts scanned. The zero on matches is not the outage’s doing; it belongs to a different bug I was chasing then, and it gets its own update.
The useful measurement is in the gap between those two attempts. INlabs was back in about 91 seconds: last 502 at 16:00:43.8, successful login at 16:02:14.7. My old three second window missed a 91 second outage by a factor of 27. The new 122 second window would have caught it on the seventh attempt, around 16:02:42.
I want to be precise about what that is. It is not proof the fix works. It is a before-and-after measured against a real outage that happened to occur while I was writing the fix for it, which is luck, not evidence.
Five weeks later, the real verdict
The evidence arrived on 25 August, and it was not the one I was hoping for.
The 08:05 run failed again, on the same maintenance page. This time the logs show seven attempts, all 502. The widened window was spent in full and the outage was still going. The job exited 1 exactly as it had in July.
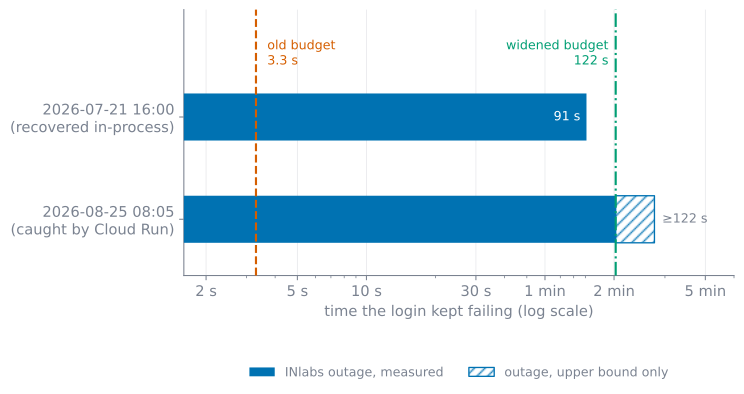
So the change I was proudest of did not do the job I built it for. What saved that morning was the layer underneath: Cloud Run re-ran the task at 08:08 and it succeeded, ingesting 3,255 acts and delivering all four digests.
And the 14:00 heartbeat read the later success and stayed quiet. That is the reschedule working on precisely the day it was designed for, five weeks after I moved it, on a failure that healed itself. Under the old 09:00 slot I would have been paged for an incident that was over before I could have opened a terminal.
Scoring the three changes honestly:
- The diagnostic logging did its job twice, in July and again in August, where it pinned an upstream 502 without anyone touching the credentials. It is the change that fixed nothing and paid for itself repeatedly.
- The heartbeat reschedule is proven, with a before-and-after on a single day in July and a clean confirmation in August.
- The widened retry window was exercised against a real outage and came up short. It is strictly better than three seconds and it is still not enough.
This is defense in depth doing what it is for, and it is worth naming which layer held. In-process retry, then Cloud Run’s task retry, then the 13:00 sweep. July’s morning failed because all three were exhausted. August’s morning survived because layer one lost and layer two held. If I only had layer one, widening it would matter enormously; because I have three, the widening is the least important of the three fixes I shipped that week.
What I learned
Write down the signature, not the conclusion. “RESOLVED: corrupted secret” is a fact about one incident that I then applied as a rule to the next one, and it pointed me directly at the wrong cause. The line worth keeping in a postmortem is what the failure looked like and what else could produce that same appearance.
Then there’s the harder one. I spent that week thinking my job was to make the failure stop. The change that mattered most made the failure legible and left it entirely intact. A day later, that told two identical-looking errors apart in a single query; five weeks later, it was still doing it. Meanwhile the change that actually attacked the failure got measured against reality and lost. I would not have predicted that ordering on the day I shipped them, and I have started asking, when something breaks twice, whether the next commit should fix it or explain it.
The last one is not really about code. RegWatch depends on a government system with no status page, no SLA and no notice of maintenance windows. I cannot make INlabs more reliable and I have no channel through which to ask. All I can do is survive its bad days, and know the difference between its bad day and my bad deploy. That second part is the whole job.
What’s next
The zero I left standing above is the thread. matches=0 on a day with 3,338 acts ingested was not a fluke, and the cause turned out to be a single word in a Postgres search configuration: a watch for contrato was never going to match contratos. The fix ran through Portuguese stemming, text normalisation and a trigram index, and it changed what the product can actually find. That is the next update.
I’m curious how other people draw this line, because I still don’t have a rule I trust: when a component fails intermittently and you can’t fix the upstream, how do you decide between spending the effort on riding the failure out and spending it on being able to see it clearly? I defaulted to the fix and got more out of the logging, but that’s one incident, not a principle. If you’ve been on the other side of that call, the series is where I’ll keep publishing what I get wrong. The previous update is where all of this looks a lot tidier from the outside.
I'm building this in the open, one update at a time.
Keep reading
- The job that fired and never ran: why both of my alerts were structurally blind to itUpdate 11 of the RegWatch build log: a weekly cleanup job was denied permission in complete silence, and neither alert policy could ever have caught it, because both watch jobs that ran and failed. Notes on one hardcoded line in a provisioning script, a storage forecast that said the free tier broke on September 4th, and what actually happened instead.October 8, 2026
- Unattended at last: RegWatch on Cloud Run, and the round-trip that nearly killed the jobUpdate 4 of the RegWatch build log: taking the daily pipeline off my laptop and onto GCP Cloud Run Jobs against Supabase. The plan was clean; the first live deploy was not. Three quick config failures, and then the one that taught me something: a cross-region round-trip that timed the job out at a full hour, until co-locating Cloud Run with the Supabase region dropped a whole gazette day to ten minutes.July 9, 2026
- A wall between tenants: RegWatch grows a secured DRF APIUpdate 5 of the RegWatch build log: the daily pipeline had a database full of matches nobody could reach, so I gave it an HTTP surface. Session auth, invite-only access, and a single workspace-scoping chokepoint that makes one firm's data 404 for another. Plus the secure-by-default reflex that crashed the batch jobs, and why one image now has to boot two ways.July 20, 2026
Get the next update by email
Build-in-public updates and new posts, delivered as a digest. Double opt-in · no spam · unsubscribe anytime · handled by Buttondown.