Finding the N+1 before it finds prod: the benchmark that couldn't fail
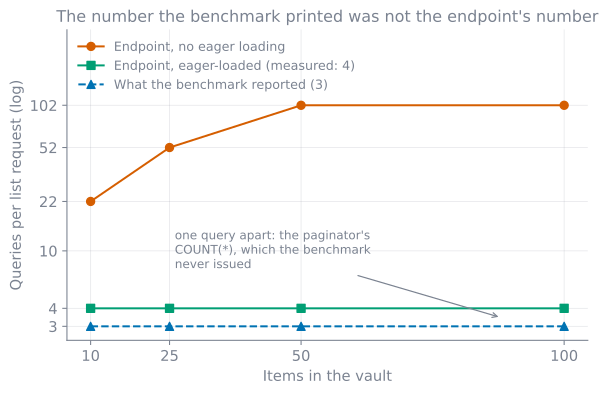
Five weeks ago I published a chart showing that the list endpoint in my personal vault costs a flat three database queries no matter how many items come back. The chart was honest. I had written a benchmark, run it, and pasted the numbers it printed.
I went back to turn that benchmark into a regression test, because a measurement you take once is a fact about last month. The plan was ordinary: delete the eager loading from the viewset, watch something go red, put the assertion in, put the eager loading back.
15 passed, 11 warnings in 4.67sThe suite passed with the fix removed. And inside that run, the benchmark printed:
100: naive= 201 eager= 3A flat three, measured on a codebase that had no eager loading in it.
What the benchmark was actually measuring
The vault is a Django REST Framework API over a single polymorphic Item table: bookmarks, recipes, journals, grocery lists, all one endpoint. Each item carries tags and attachments, which is the setup for the classic N+1 query problem: one query to fetch a page of rows, then two more per row as the serializer renders each item’s related sets. The fix is eager loading, select_related for the single-valued relations and prefetch_related for the many-valued ones. I wrote that up properly when I built the thing, in the post about the polymorphic vault API. The measurement turned out to be the harder half.
Here is the load-bearing part of the benchmark I wrote to feed that chart:
def _naive_qs(user):
    return Item.objects.filter(owner=user).order_by("-created_at")


def _eager_qs(user):
    return (
        Item.objects.filter(owner=user)
        .order_by("-created_at")
        .select_related("owner")
        .prefetch_related("tags", "attachments")
    )


def _count_queries(qs, page_size, request):
    with CaptureQueriesContext(connection) as ctx:
        data = ItemSerializer(qs[:page_size], many=True, context={"request": request}).data
        list(data)
    return len(ctx)
Read it as an outsider and the flaw is obvious. _eager_qs is a queryset the test file builds. It has no connection to ItemViewSet.get_queryset, which is the code the application actually runs. The two happened to contain the same three chained calls on the day I wrote them, and after that they were free to drift apart forever without a word.
The benchmark was measuring the technique. I had read it as measuring the endpoint. It answered “does prefetch_related reduce query counts”, which is a question about Django, already settled, and asked nowhere near the question I cared about: does the thing I deploy still do this?
That file is a benchmark, not a regression test. A benchmark produces a number for a human to look at. A regression test compares a number against a committed expectation and fails. Mine had two assertions at the bottom, and they were both about the shape of its own output: that the naive series increases, and that the eager series is constant. Both hold perfectly well when the eager series is constant because the test file made it constant. Nothing in that file could ever have noticed the deletion I made.
The endpoint’s number is not three
So I measured the real thing: drive /api/items/ through DRF’s APIClient, so the request goes through the router, the viewset, the paginator, the permission class and the real serializer, and count queries around it.
The endpoint costs four queries, not three. Here they are:
1: SELECT COUNT(*) AS "__count" FROM "vault_item" WHERE "vault_item"."owner_id" = 1
2: SELECT "vault_item"."id", "vault_item"."owner_id", "vault_item"."kind", ...
3: SELECT ("vault_item_tags"."item_id") AS "_prefetch_related_val_item_id", ...
4: SELECT "vault_attachment"."id", "vault_attachment"."owner_id", ...
Queries 2, 3 and 4 are the three the benchmark found: the page itself with owner folded into the join, then the tags prefetch, then the attachments prefetch. Query 1 is the one it structurally could not see. PageNumberPagination issues a COUNT(*) to build the count field in the response envelope, and the benchmark never touched a paginator, because it sliced a queryset by hand.
One query out of four is a rounding error in a latency budget. It matters entirely because of what a regression test does with it: assertNumQueries(3) on that endpoint fails immediately, forever, on correct code. The number you assert has to come from the path you serve, or the assertion is unusable on day one.
The scary version of this bug is bounded
Measuring the endpoint turned up something that cut the other way, in my favour.
I re-ran the whole thing with the eager loading removed from ItemViewSet.get_queryset, across four vault sizes:
The unguarded line climbs 22, 52, 102 and then stops. It stops because the page size is fixed at 50 on the server, so past a hundred items page one still returns fifty rows and still costs 1 COUNT + 1 page + 2 lookups × 50 rows. Pagination caps the N+1’s blast radius. The endpoint was never going to degrade without limit as the vault filled up; the worst case was pinned at 102 queries from the moment PAGE_SIZE was set.
That is worth knowing precisely because the usual telling of this bug is apocalyptic. “It works with ten rows and melts in production” is true for an unpaginated endpoint and false for this one. What I actually had was a fixed, permanent 102 queries where 4 would do, on a hot read path, which is bad in a boring, steady way.
There is a related detail I only noticed while setting the sizes up: ?page_size= does nothing on this API. PageNumberPagination ignores the query parameter unless you set page_size_query_param, which I never did. So no client can widen that page, which makes the ceiling above a structural fact rather than a default someone can opt out of.
Pinning the number
The replacement test drives the endpoint and asserts a budget:
#: 1 COUNT + 1 page + 1 tags prefetch + 1 attachments prefetch.
ITEM_LIST_QUERY_BUDGET = 4


@pytest.mark.django_db
def test_item_list_stays_within_its_query_budget(django_assert_num_queries):
    ...
    _seed(user, tags, 0, 10)
    with django_assert_num_queries(ITEM_LIST_QUERY_BUDGET):
        assert client.get("/api/items/").status_code == 200

    # Five times the rows, same budget.
    _seed(user, tags, 10, 50)
    with django_assert_num_queries(ITEM_LIST_QUERY_BUDGET):
        response = client.get("/api/items/")
    assert len(response.json()["results"]) == 50
django_assert_num_queries is pytest-django’s wrapper around Django’s assertNumQueries. Two assertions at different data sizes: a single fixed count would also pass if the endpoint were quadratic and I happened to name the quadratic number. Ten rows and fifty rows costing the same is the property I actually want, and asserting it twice is how the flatness gets tested rather than assumed.
The comment above the constant is doing real work too. 4 on its own is a magic number that the next person deletes or bumps when it goes red. 4 with its four queries named is a claim someone has to argue with, and if a fifth query appears the diff makes them say what it is.
Notice which query is not in that list. select_related("owner") does not add one. It compiles to a SQL JOIN and the owner columns ride along in query 2, whereas prefetch_related genuinely issues a second statement per relation and joins in Python. So a budget of 4 for two prefetched relations is exactly right, and if I add a third prefetch_related tomorrow the number becomes 5 and this test tells me so at the moment I write it rather than the week I deploy it.
The first draft of the test had one more line: a throwaway client.get() before the measured one, on the theory that the first request through a fresh test client pays some one-off cost that would inflate the count. I deleted the warm-up and re-ran to see how much it was hiding. Nothing: the same four, first call included. force_authenticate skips the session and user lookups a real login would add, and nothing else on the path initialises lazily. It went in as a defensive reflex, and a defensive line I never measured is exactly the kind of thing that had put me here in the first place, so it came out.
Then the same experiment as before, deleting .prefetch_related("tags", "attachments") from the viewset:
E Failed: Expected to perform 4 queries but 22 were doneRed at the first assertion, at ten items, before the fifty-item case even runs. Which is what I had assumed the old benchmark was doing for the last five weeks.
Which endpoints get one
Not all of them, or the suite becomes a wall of numbers nobody maintains.
The endpoints worth a budget are the ones where a related-object lookup sits inside a loop the framework runs for you: any list route whose serializer has a nested many=True field, which in this API means items with their tags and attachments, and recipes with their steps and ingredients. Those are the places where correct-looking code, an ordinary ModelSerializer over an ordinary queryset, produces a cost that scales with the response. A detail route serialising one object has no loop and needs no budget.
That is the same reasoning I use to decide which scheduled jobs need an idempotency check rather than a hopeful retry: find the places where the failure is structural rather than occasional, and spend the test there.
What I would keep
Test through the entry point the application uses. Every step my benchmark skipped (the router, the paginator, the viewset’s own get_queryset) was a step that could hold either a bug or a query, and skipping them is what let the file be simultaneously correct and useless. It is the same reason I eventually replaced the fakes in RegWatch’s pipeline with a real daily run.
Prefer a budget over a benchmark for anything you want to stay true. A printed number is a fact about the day it was printed. It becomes a guarantee when something fails without it, and the gap between those two is invisible from inside a green test run.
Before trusting a guard, delete the thing it guards and watch it fail. It costs one commit you throw away. I have been caught by this twice in a month now, in two different repos: the other was an import contract that reported three kept, zero broken while a module reached straight past the seam it was meant to protect.
And re-run the finding your work rests on, occasionally. I only found this because I went back to a measurement I had already published, which is the same reason I re-ran the runtime finding underneath supskill before building another update on top of it.
The old benchmark is still in the repo, still printing its four numbers, still naming in its docstring the chart it feeds. What changed is that nothing depends on it anymore. If you have a chart in a README or a blog post that says your API is fast, the question worth asking is what would happen today if you deleted the code that made it true.
Want the full background behind work like this?
Keep reading
- An API-first vault my agents can call: designing a DRF backend for MCP-style consumersI built a vault so a skill or an agent could store structured items without me rewriting the domain each time. That meant designing the DRF API for a non-human caller: stable UUIDs, an open metadata field, and a discoverable OpenAPI schema. Then I probed it for idempotency and found I never built any.August 18, 2026
- One flexible API for many shapes: polymorphic vaults in Django REST FrameworkStoring recipes, bookmarks, journals and groceries behind a single REST surface: a polymorphic Item base, dynamically composed nested serializers, atomic multi-table writes, and the eager-loading that kills the N+1 queries.July 9, 2026
- pgvector as an agent's long-term memory: user rules that survive the sessionMy bookkeeping assistant had my personal filing quirks hardcoded into its system prompt. The fix wasn't a bigger prompt: it was storing each learned rule as a pgvector embedding and retrieving it by similarity at registration time.August 20, 2026
Get the next update by email
Build-in-public updates and new posts, delivered as a digest. Double opt-in · no spam · unsubscribe anytime · handled by Buttondown.